
Building a Production-Ready GeoServer Stack with Keycloak, Loki & Prometheus
Posted on May 4, 2026
1 min read
By Megha K. Shinde
Introduction
GeoServer is powerful for serving geospatial data, but in real-world deployments, it lacks a few critical capabilities out of the box:
- Centralized authentication (SSO)
- Log aggregation and monitoring
- Observability for debugging and performance
In this blog, we’ll build a production-ready GeoServer stack using:
- GeoServer
- Keycloak
- Loki
- Prometheus
- Grafana
Architecture Overview
Flow
- User accesses GeoServer
- Redirected to Keycloak (SSO login)
- Keycloak authenticates and returns token
- GeoServer maps roles
- Logs → Loki via Promtail
- Metrics → Prometheus
- Visualization → Grafana
Project Structure
docker-compose.yml
geoserver/
keycloak/
loki/
promtail/
prometheus/
grafana/
scripts/
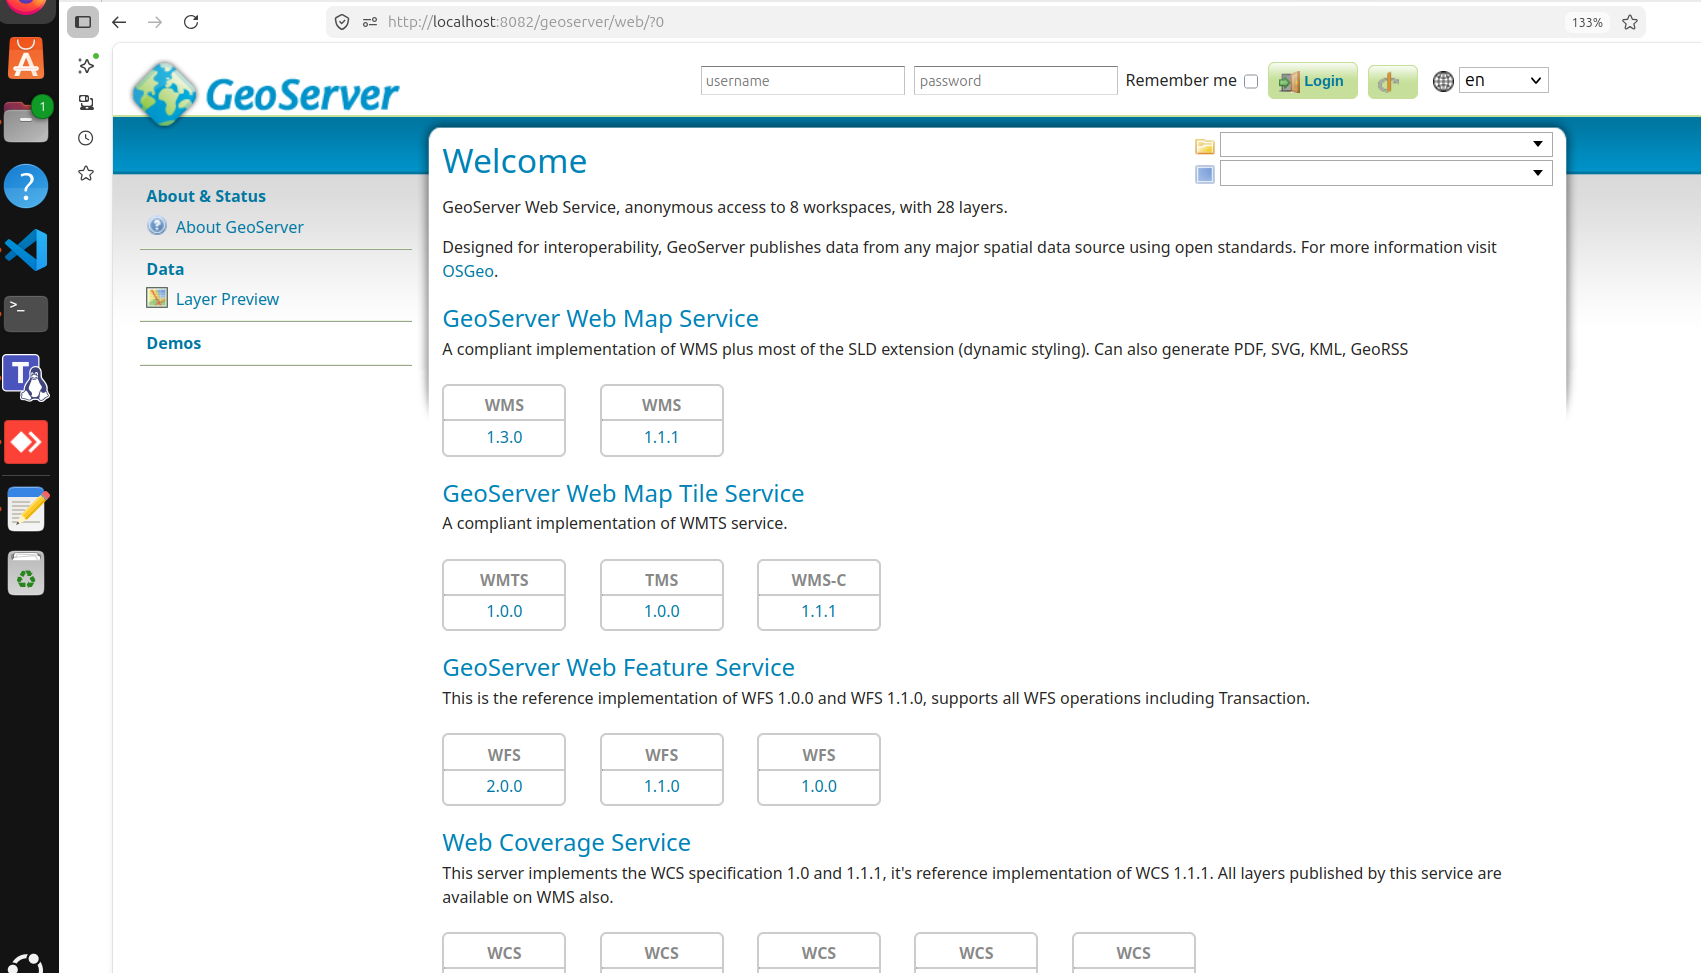
🌍 GeoServer Setup
GeoServer acts as the core geospatial engine:
- WMS, WFS, WCS services
- Admin UI
- Plugin-based extensions
🔐 Keycloak Integration (SSO)
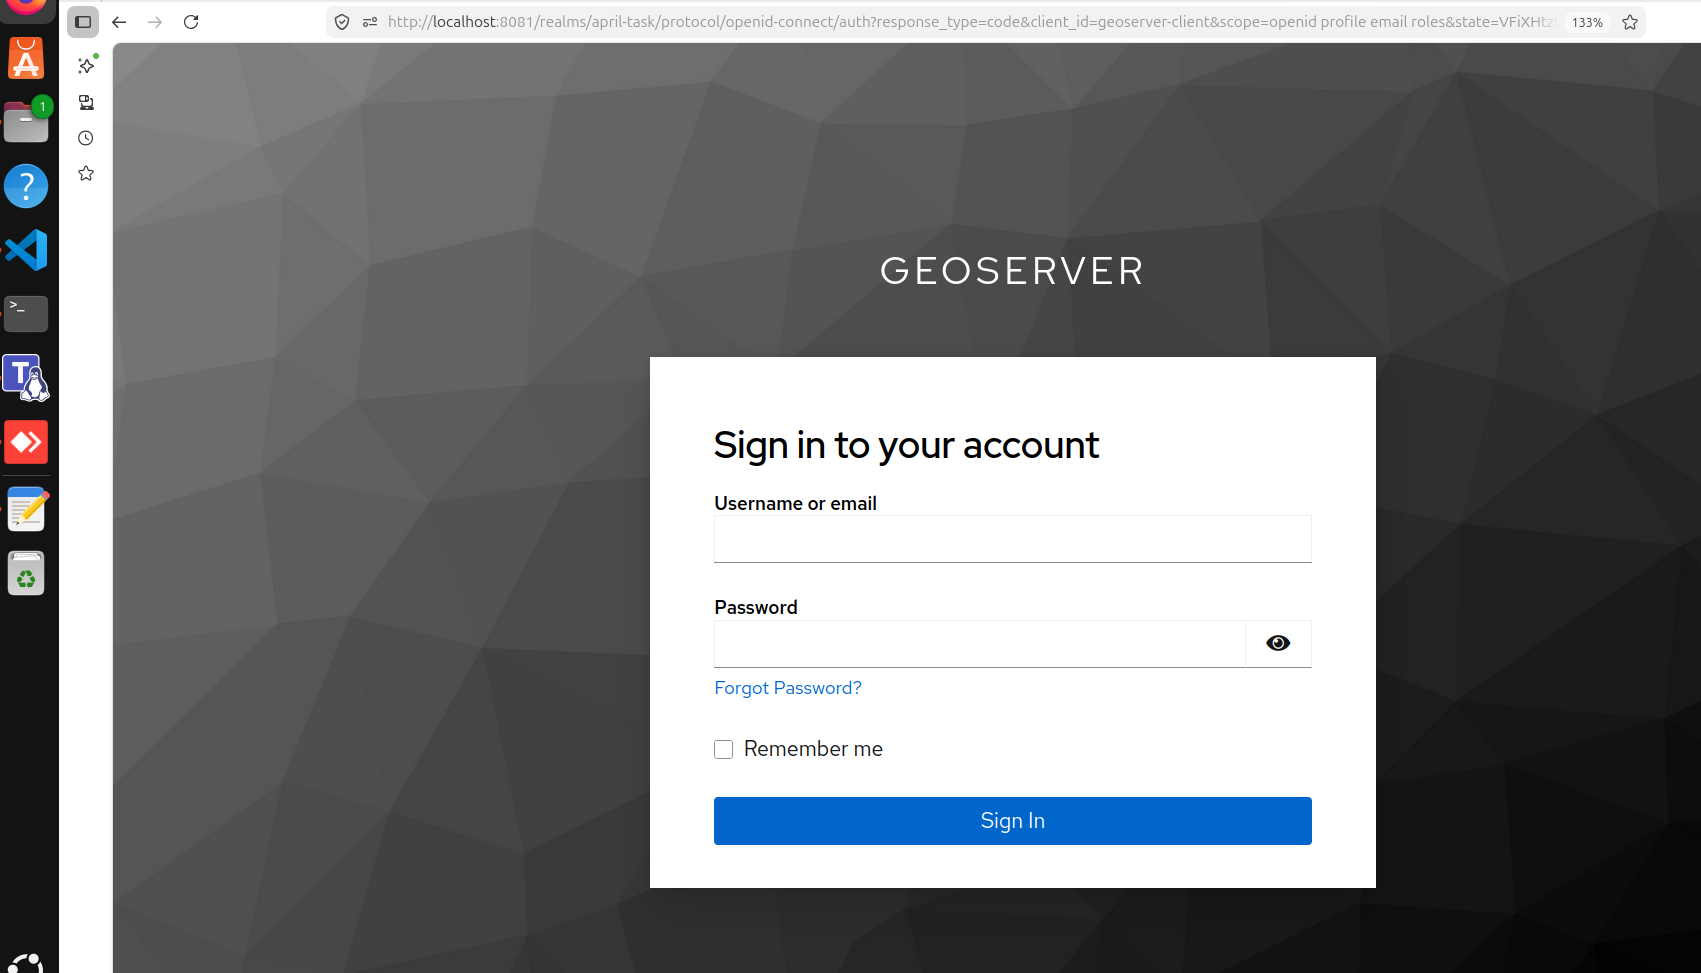
Keycloak provides:
- Centralized login
- Role-based access control
- OIDC integration
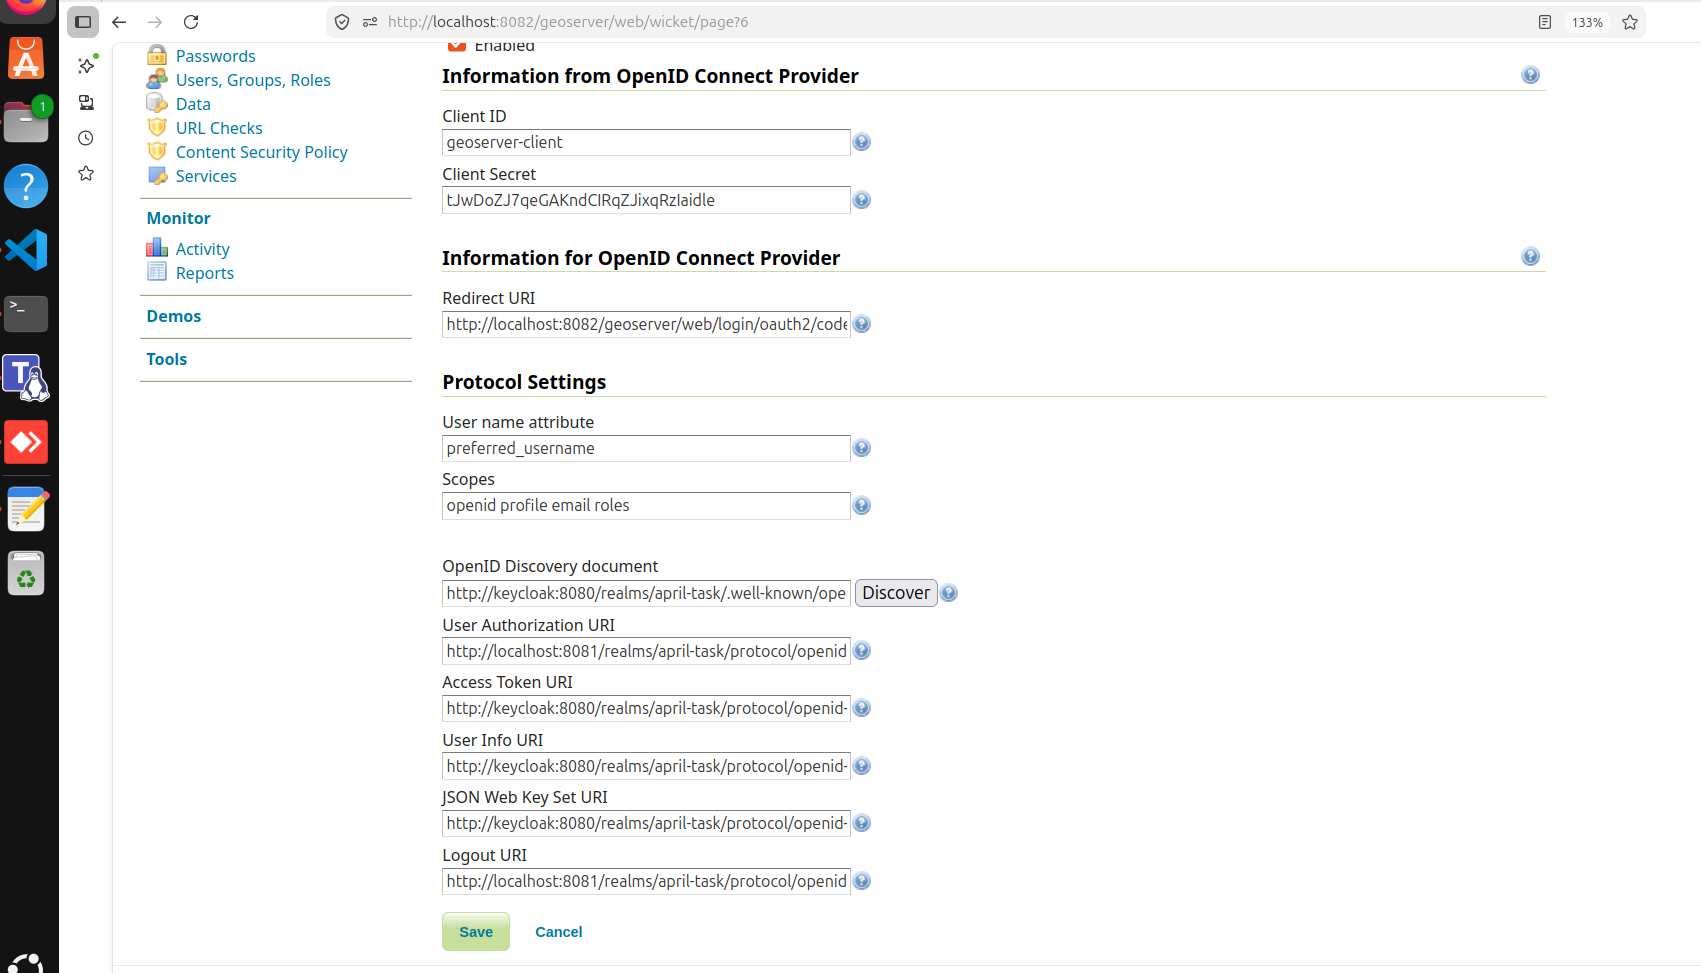
⚙️ Setup Highlights:
- Realm:
april-task - Client:
geoserver-client - Roles:
geoserverAdmingeoserverUser
Critical Learning: Internal vs External URLs
This was one of the biggest issues:
| Context | URL |
|---|---|
| Browser | http://localhost:8081 |
| Container | http://keycloak:8080 |
❗ If you use localhost inside Docker → OIDC will break
ROLE MAPPING
geoserverAdmin=ROLE_ADMINISTRATOR
geoserverUser=ROLE_AUTHENTICATED
GeoServer → Security → Authentication → OIDC config
Logging with Loki
Loki + Promtail helps collect logs from:
- GeoServer logs
- Tomcat logs
- Audit logs

🚨 Issue Faced
Dashboard was empty
Because only logs existed:
geoservergeoserver_access
But dashboard expected:
geoserver_audit
👉 This mismatch caused confusion
✅ Fix
Enable GeoServer monitoring:
audit.enabled=true
micrometer.enabled=true
After fix:
geoserver_audit.logcreated ✔Loki started receiving correct logs ✔
Troubleshooting Section (MOST IMPORTANT )
Issue 1: Keycloak not redirecting
- Cause: Wrong redirect URI
- Fix: Correct OIDC configuration
Issue 2: File download instead of login
- Cause: Misconfigured authentication filter
- Fix: Fix filter chain
Issue 3: Empty Grafana dashboard
- Cause: Missing audit logs
- Fix: Enable monitoring
Issue 4: Admin role not working
- Cause: Username conflict (
admin) - Fix:
- Use different user (e.g.,
megha-admin) - Keep default admin as fallback
- Use different user (e.g.,
🧠 Key Learnings
- Docker networking matters (very important)
- Authentication ≠ Authorization
- Observability requires proper instrumentation
- Always keep fallback admin access
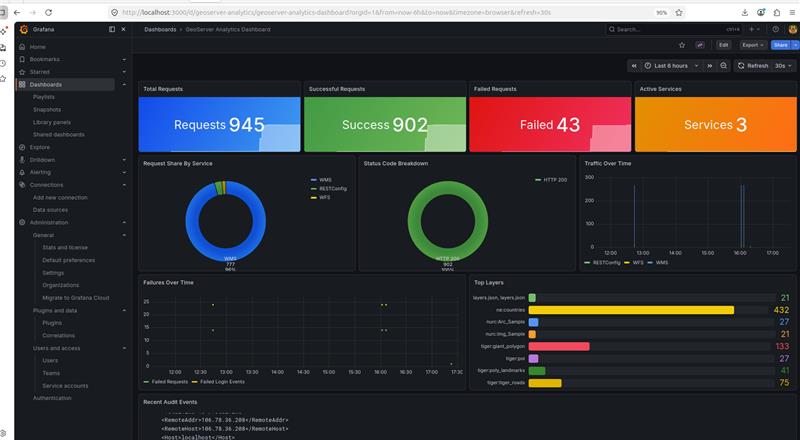
Final Result
✔ GeoServer with persistent config
✔ Keycloak SSO login
✔ Role-based access
✔ Logs in Loki
✔ Metrics in Prometheus
✔ Dashboards in Grafana
Future Improvements
- Combine all services into one clean
docker-compose.yml - Add HTTPS (production ready)
- Add Nginx reverse proxy
- Scale GeoServer (HA setup)
🎯 Conclusion
GeoServer alone is not enough for modern systems.
With Keycloak, Loki, and Prometheus, it becomes:
👉 Secure
👉 Observable
👉 Production-ready

