

Serving Vector Tiles using Geoserver
GeoServer is a powerful open-source server software designed for the management and dissemination of geospatial data. It plays a crucial role in the world of geospatial technology by providing a versatile platform for sharing geospatial information in various standard formats.
One of its key capabilities is the ability to export data as Web Map Service (WMS), Web Feature Service (WFS), and GeoWebCache (GWC), making it an essential tool for organizations and individuals working with geospatial data.
WMS capability allows users to access and share map images over the internet in a standardised format, making it easy for clients to display maps with various software applications. It serves as a valuable tool for creating interactive and dynamic web maps.
WFS, on the other hand, enables the sharing of vector data, offering the ability to access and manipulate geospatial features on the server. This facilitates data editing, querying, and analysis, making GeoServer a fundamental component in many Geographic Information System (GIS) workflows.
Furthermore, GeoWebCache (GWC) provides a powerful caching mechanism, enhancing the performance and scalability of WMS services. It optimizes the delivery of map images by storing pre-rendered tiles, reducing the load on the server and improving the user experience.
Vector tiles have surged in popularity in the realm of geospatial technology because they offer a compelling fusion of the best features of both Web Map Service (WMS) and Web Feature Service (WFS). These tiles represent a groundbreaking approach to delivering geospatial data over the web. The primary reason for their increasing acclaim is their ability to seamlessly blend the advantages of WMS and WFS, providing a versatile solution for a wide range of applications.
With vector tiles, users benefit from the dynamic, interactive nature of WFS. They can access and manipulate individual features within the map, enabling advanced querying and analytical capabilities. At the same time, vector tiles inherit the speed and efficiency of WMS, offering pre-rendered map data that can be quickly displayed without the need for intensive server-side processing. This combination results in fast, responsive, and data-rich web maps. As a result, vector tiles have gained significant popularity in a variety of applications, from interactive online maps and mobile navigation to geospatial analytics, offering a robust solution that bridges the gap between traditional map images and dynamic feature data, satisfying the diverse needs of geospatial users.
In this blog, we’ll explore how we can share geospatial data as Vector tiles using GeoServer. If you are interested into similar results using pygeoapi, you can checkout my previous blog.
Installing vector tile plugin
Vector Tiles is not the default format (as of now) in Geoserver, thus you will need to install it as a separate extension.
You can find extension on https://build.geoserver.org/geoserver → version → ext-latest , here look for vectortiles. Once downloaded , install it and restart Geoserver.

If you are having trouble installing extension, checkout my video
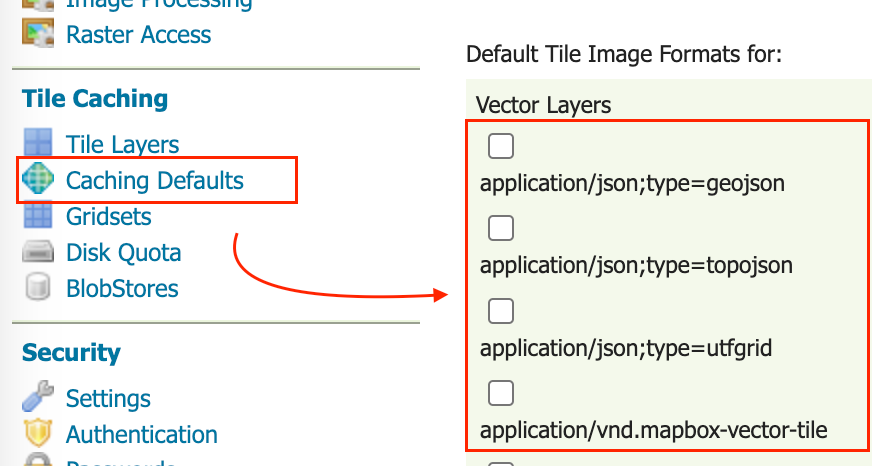
To confirm if extension is installed, check if more formats are available under caching defaults
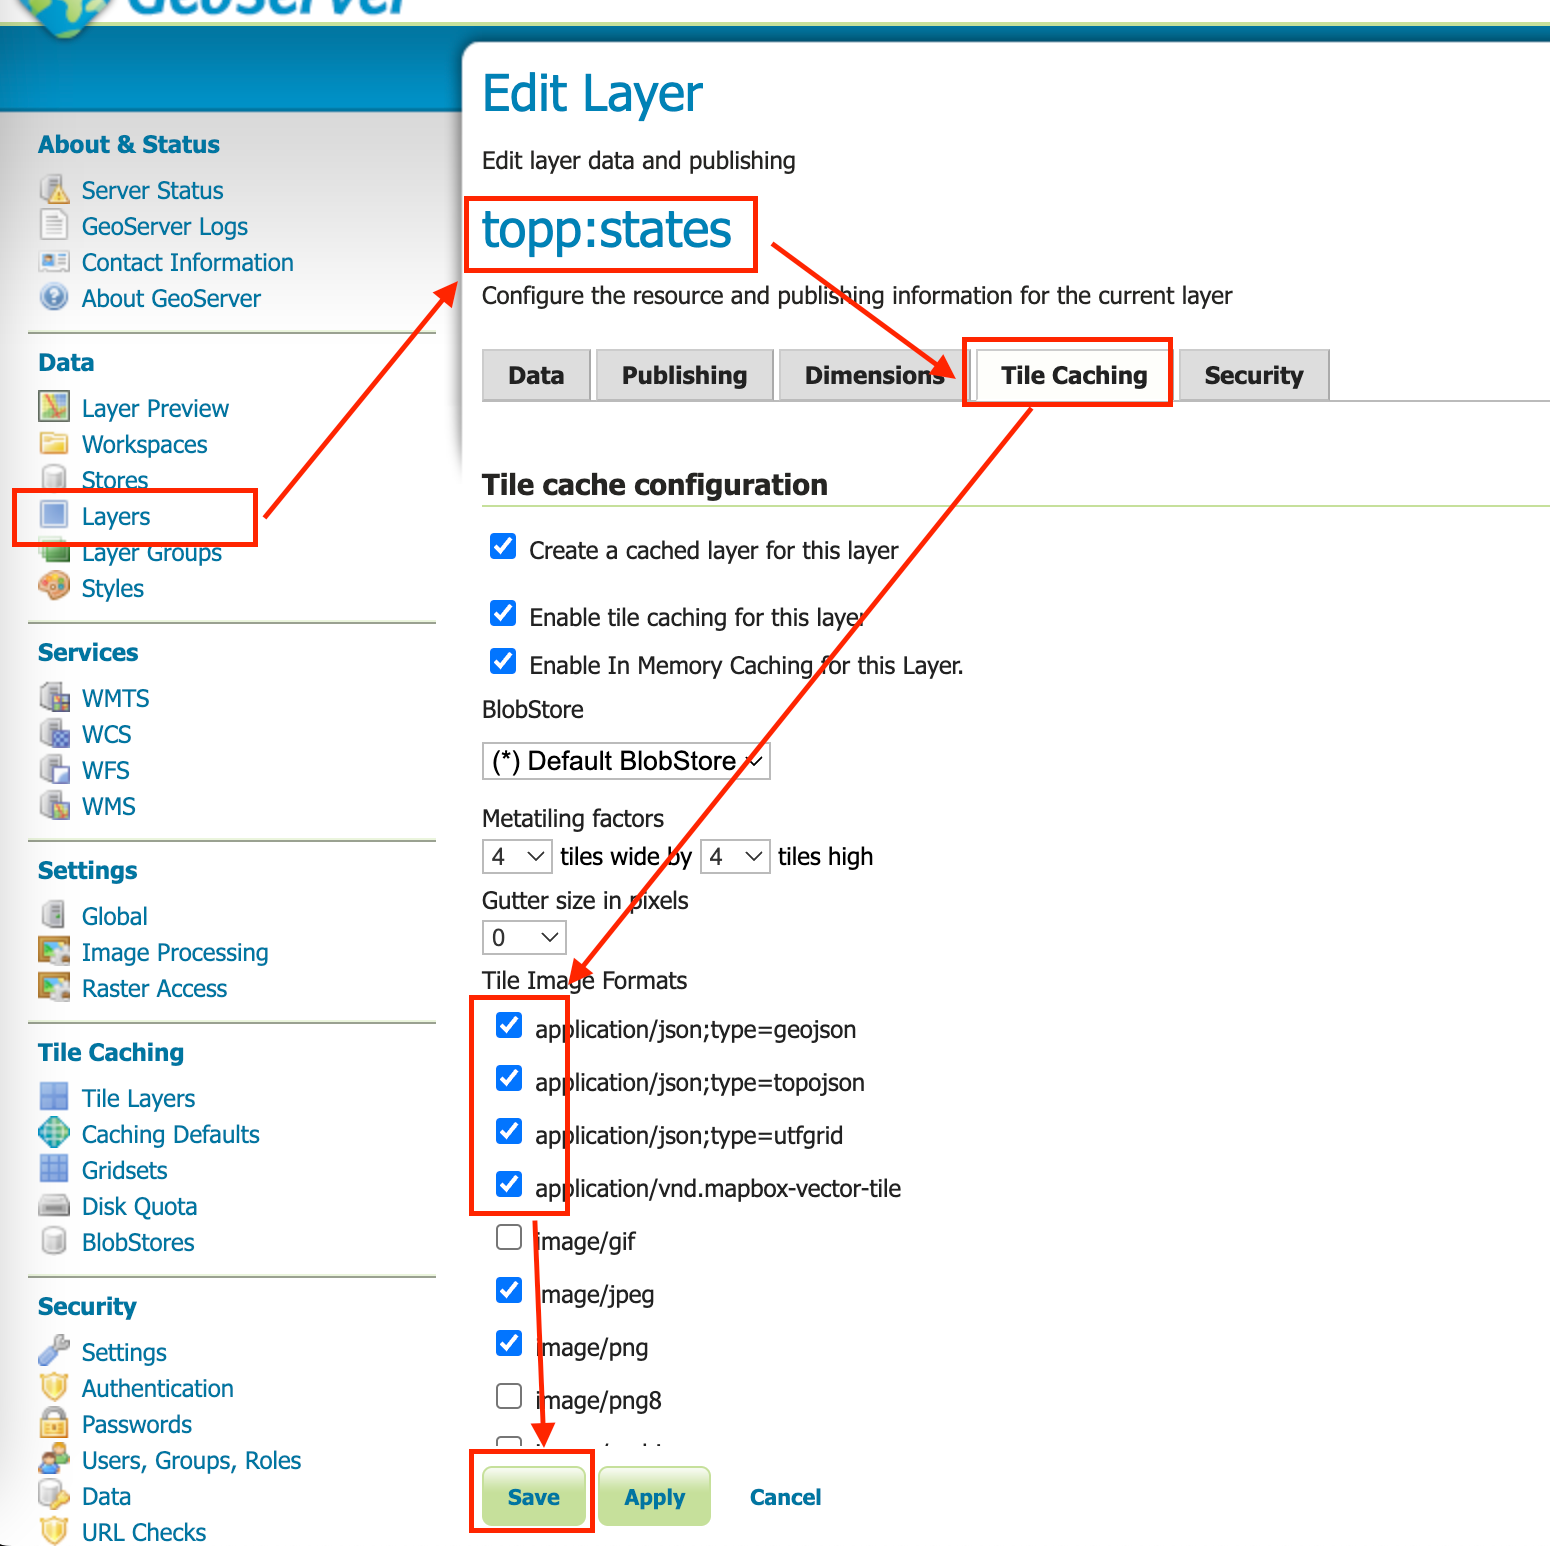
✔️ all the extensions that you want, and then head over to any of the layer you are interested to use as Vector tile. Once clicked on layer, click on Tile Caching and ✔️ Vector tile format.
Once done, you can start using it in Front end.
Openlayers
<!DOCTYPE html>
<html>
    <head>
        <title>Vector Tiles</title>
        <link rel="stylesheet" href="https://openlayers.org/en/v4.6.5/css/ol.css" type="text/css" />
        <!-- The line below is only needed for old environments like Internet Explorer and Android 4.x -->
        <script src="https://cdn.polyfill.io/v2/polyfill.min.js?features=requestAnimationFrame,Element.prototype.classList,URL"></script>
        <script src="https://openlayers.org/en/v4.6.5/build/ol.js"></script>
        <style>
            .map {
                background: #f8f4f0;
            }
        </style>
    </head>
    <body>
        <div id="map" class="map"></div>
        <script>
            var map = new ol.Map({
                target: "map",
                view: new ol.View({
                    center: [0, 0],
                    zoom: 1,
                }),
                layers: [
                    new ol.layer.VectorTile({
                        source: new ol.source.VectorTile({
                            tilePixelRatio: 1, // oversampling when > 1
                            tileGrid: ol.tilegrid.createXYZ({ maxZoom: 19 }),
                            format: new ol.format.MVT(),
                            defaultDataProjection: "EPSG:4326",
                            url: "http://localhost:8080/geoserver/gwc/service/tms/1.0.0/topp:states" + "@EPSG%3A4326@pbf/{z}/{x}/{-y}.pbf",
                        }),
                    }),
                ],
            });
        </script>
    </body>
</html>
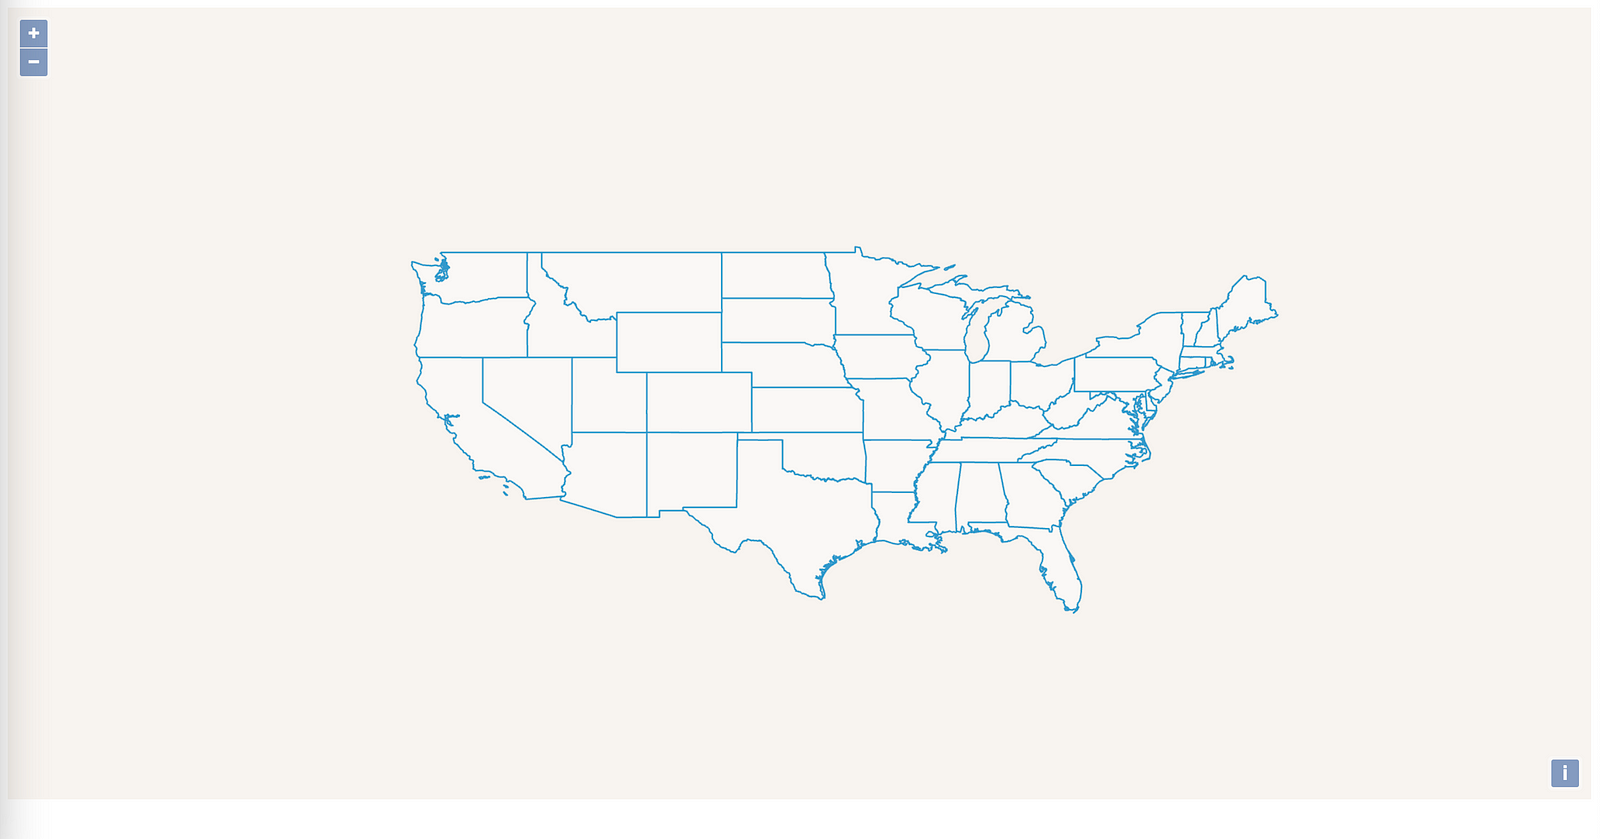
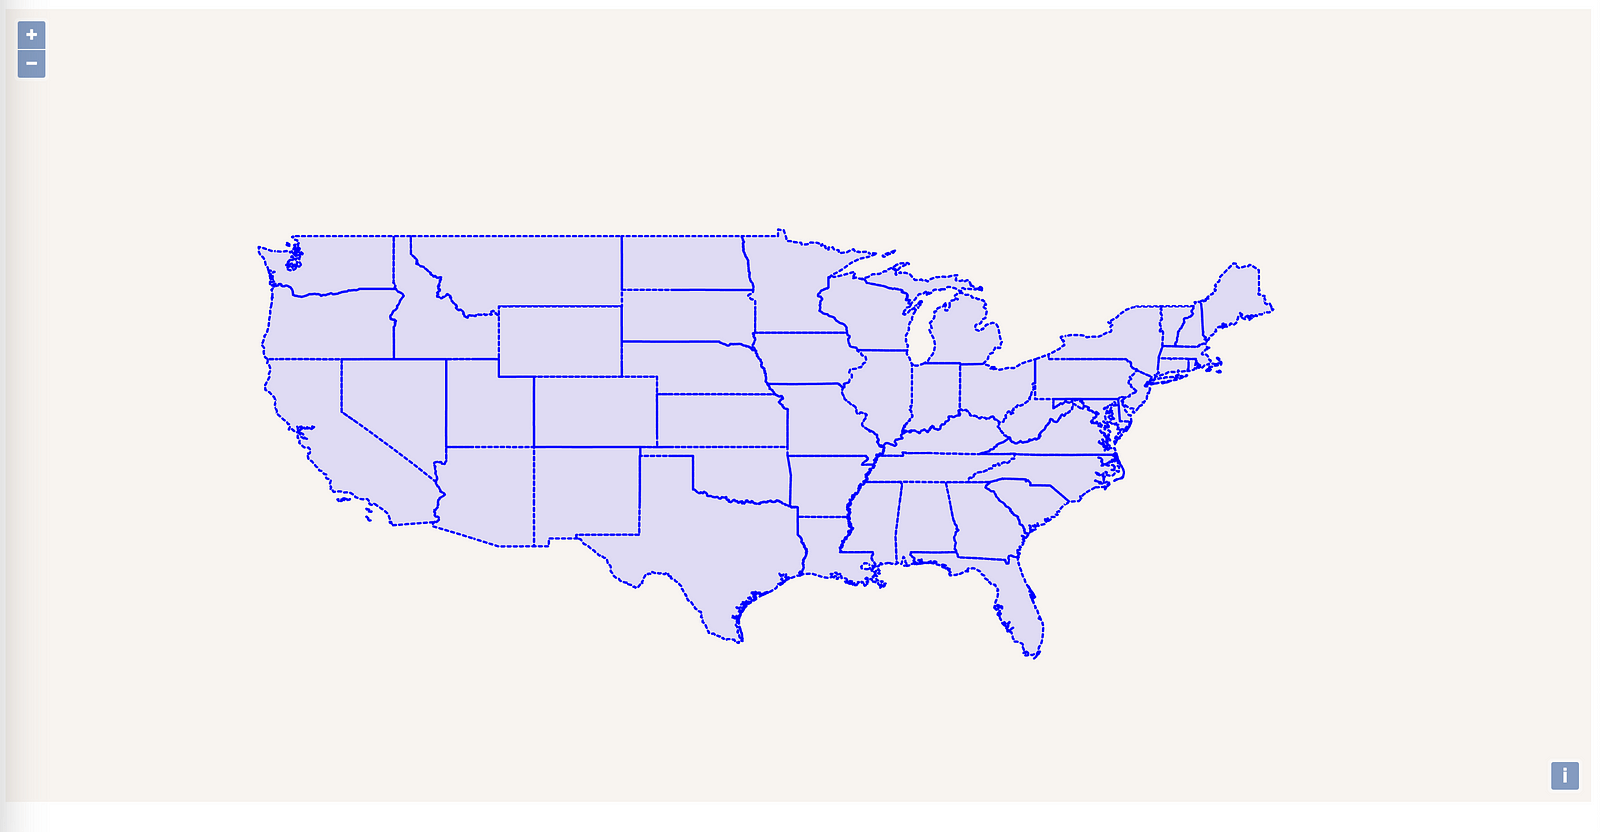
You can start styling data from Openlayers
<!DOCTYPE html>
<html>
    <head>
        <title>Vector Tiles</title>
        <link rel="stylesheet" href="https://openlayers.org/en/v4.6.5/css/ol.css" type="text/css" />
        <!-- The line below is only needed for old environments like Internet Explorer and Android 4.x -->
        <script src="https://cdn.polyfill.io/v2/polyfill.min.js?features=requestAnimationFrame,Element.prototype.classList,URL"></script>
        <script src="https://openlayers.org/en/v4.6.5/build/ol.js"></script>
        <style>
            .map {
                background: #f8f4f0;
            }
        </style>
    </head>
    <body>
        <div id="map" class="map"></div>
        <script>
            var map = new ol.Map({
                target: "map",
                view: new ol.View({
                    center: [0, 0],
                    zoom: 1,
                }),
                layers: [
                    new ol.layer.VectorTile({
                        source: new ol.source.VectorTile({
                            tilePixelRatio: 1, // oversampling when > 1
                            tileGrid: ol.tilegrid.createXYZ({ maxZoom: 19 }),
                            format: new ol.format.MVT(),
                            defaultDataProjection: "EPSG:4326",
                            url: "http://localhost:8080/geoserver/gwc/service/tms/1.0.0/topp:states" + "@EPSG%3A4326@pbf/{z}/{x}/{-y}.pbf",
                        }),
                        style: new ol.style.Style({
                            stroke: new ol.style.Stroke({
                                color: "blue",
                                lineDash: [4],
                                width: 3,
                            }),
                            fill: new ol.style.Fill({
                                color: "rgba(0, 0, 255, 0.1)",
                            }),
                        }),
                    }),
                ],
            });
        </script>
    </body>
</html>
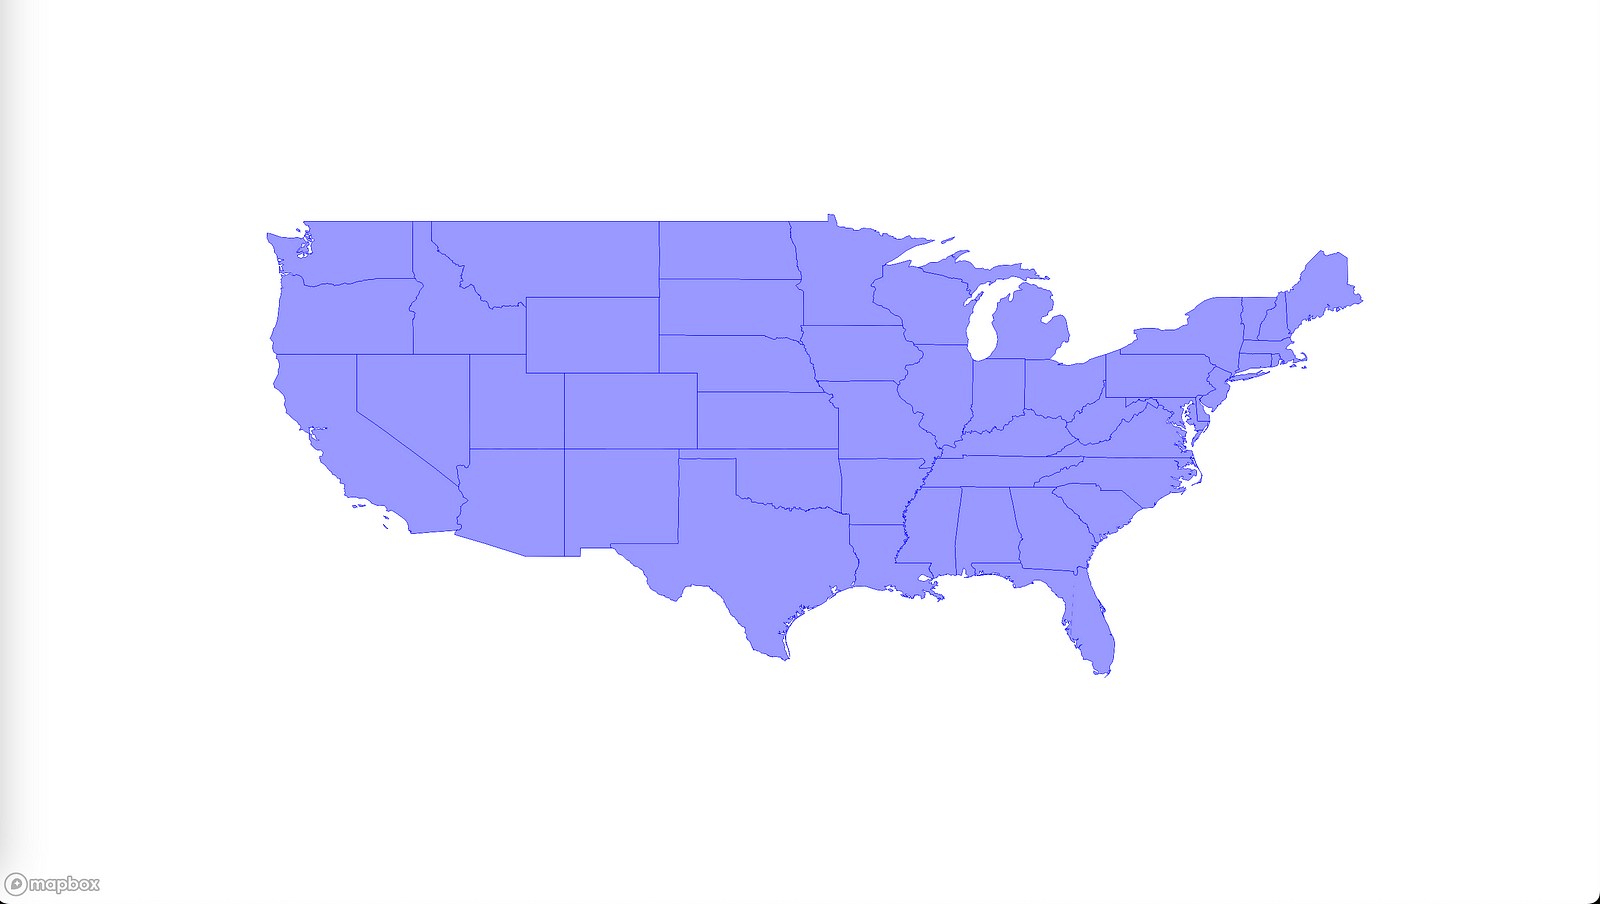
Mapbox GL JS
<!DOCTYPE html>
<html>
    <head>
        <meta charset="utf-8" />
        <title>Add a vector tile source</title>
        <meta name="viewport" content="initial-scale=1,maximum-scale=1,user-scalable=no" />
        <link href="https://api.mapbox.com/mapbox-gl-js/v2.14.1/mapbox-gl.css" rel="stylesheet" />
        <script src="https://api.mapbox.com/mapbox-gl-js/v2.14.1/mapbox-gl.js"></script>
        <style>
            body {
                margin: 0;
                padding: 0;
            }
            #map {
                position: absolute;
                top: 0;
                bottom: 0;
                width: 100%;
            }
        </style>
    </head>
    <body>
        <div id="map"></div>
        <script>
            mapboxgl.accessToken = "Mapbox KEY";
            const map = new mapboxgl.Map({
                container: "map",
                minZoom: 0,
                maxZoom: 13,
                pitchWithRotate: false, // 3D Ansicht
                touchPitch: false,
                dragRotate: false, // rotation
                style: {
                    version: 8,
                    sources: {
                        "plz-ort-source": {
                            type: "vector",
                            scheme: "tms",
                            tiles: ["http://localhost:8080/geoserver/gwc/service/tms/1.0.0/topp:states@EPSG:4326@pbf/{z}/{x}/{y}.pbf"],
                            minzoom: 0,
                            maxzoom: 14,
                        },
                    },
                    layers: [
                        {
                            id: "plz-ort",
                            type: "fill",
                            source: "plz-ort-source",
                            "source-layer": "states",
                            layout: {},
                            paint: {
                                "fill-color": "rgba(0, 0, 255, 0.4)",
                                "fill-outline-color": "rgba(0, 0, 255, 1)",
                            },
                        },
                    ],
                },
                center: [10, 51], // starting position [lng, lat]
                zoom: 5,
            });
        </script>
    </body>
</html>
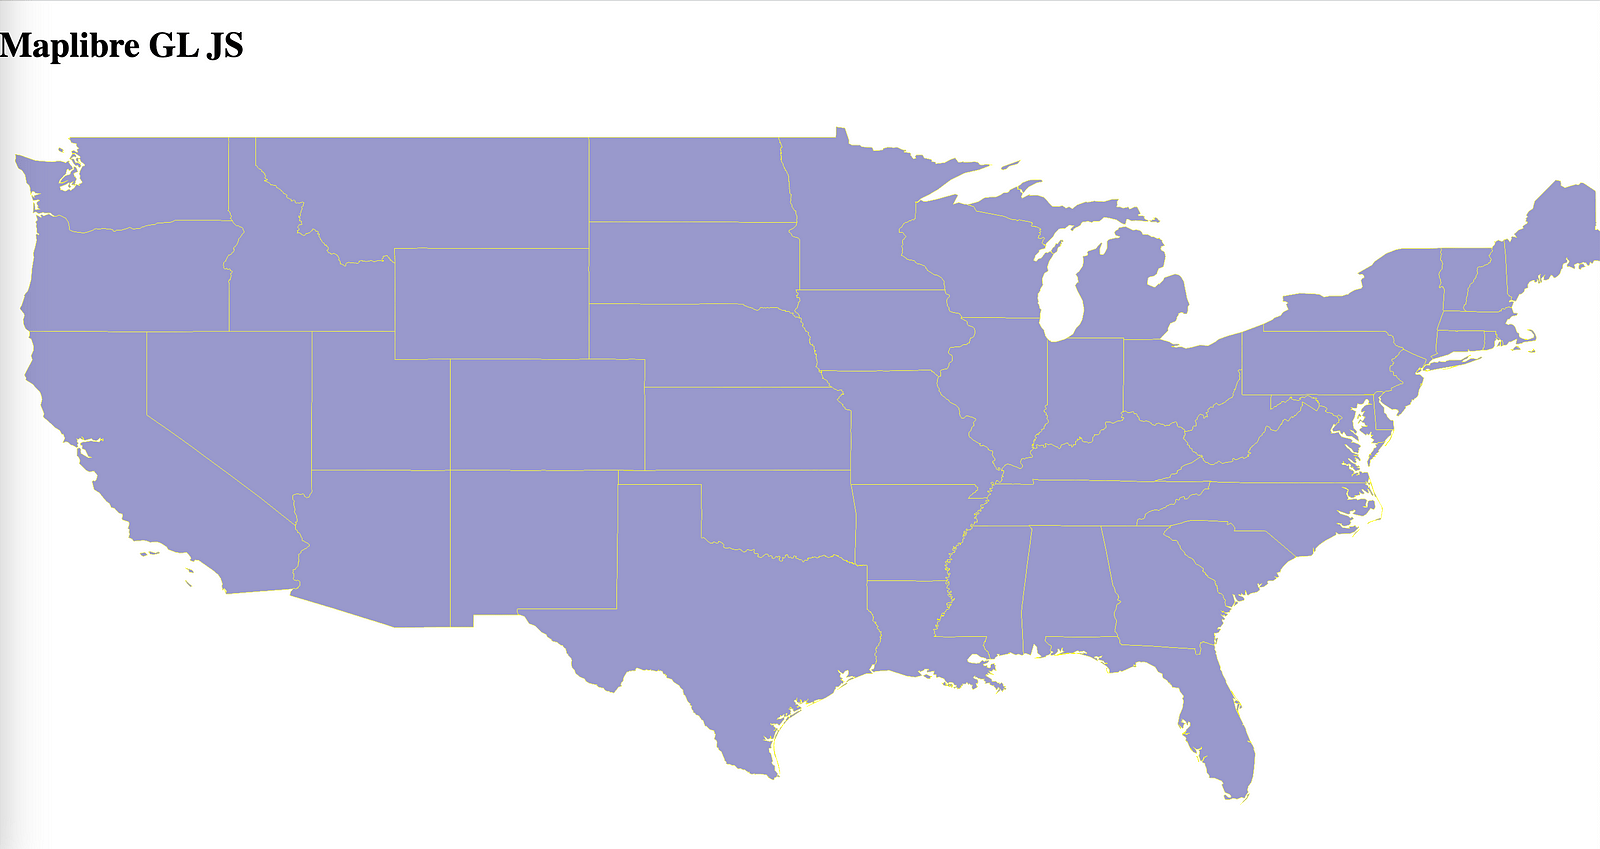
Maplibre GL JS
<!DOCTYPE html>
<html lang="en">
    <head>
        <title>Add a default marker</title>
        <meta property="og:description" content="Add a default marker to the map." />
        <meta charset="utf-8" />
        <meta name="viewport" content="width=device-width, initial-scale=1" />
        <link rel="stylesheet" href="https://unpkg.com/maplibre-gl@3.5.2/dist/maplibre-gl.css" />
        <script src="https://unpkg.com/maplibre-gl@3.5.2/dist/maplibre-gl.js"></script>
        <style>
            body {
                margin: 0;
                padding: 0;
            }
            html,
            body,
            #map {
                height: 100%;
            }
        </style>
    </head>
    <body>
        <h1>Maplibre GL JS</h1>
        <div id="map"></div>

        <script>
            const map = new maplibregl.Map({
                container: "map",
                minZoom: 0,
                maxZoom: 13,
                pitchWithRotate: false, // 3D Ansicht
                touchPitch: false,
                dragRotate: false, // rotation
                style: {
                    version: 8,
                    sources: {
                        "plz-ort-source": {
                            type: "vector",
                            scheme: "tms",
                            tiles: ["http://localhost:8080/geoserver/gwc/service/tms/1.0.0/topp:states@EPSG:4326@pbf/{z}/{x}/{y}.pbf"],
                            minzoom: 0,
                            maxzoom: 14,
                        },
                    },
                    layers: [
                        {
                            id: "plz-ort",
                            type: "fill",
                            source: "plz-ort-source",
                            "source-layer": "states",
                            layout: {},
                            paint: {
                                "fill-color": "rgba(0, 0, 123, 0.4)",
                                "fill-outline-color": "rgba( 255,255,0, 1)",
                            },
                        },
                    ],
                },
                center: [10, 51], // starting position [lng, lat]
                zoom: 5,
            });
        </script>
    </body>
</html>
Problems you might face
CORS error while getting data
Make Sure that your Geoserver’s CORS policy is up to date. Refer to following for resolving CORS
https://www.linkedin.com/pulse/fixing-cors-error-geoserver-krishna-lodha/
400 (Bad Request)
If you are not able to see data of your layer , checkout console log to understand the issue.
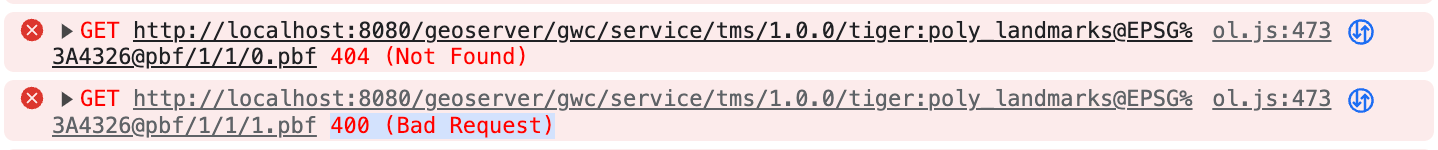
If you are getting above mentioned issue, it might be because you have not ✔️ the extension in Tile caching for the layer.