

Beyond Shapefile and GeoJSON: A Plain-English Guide to Cloud-Native Data Formats
5 min read
By Pratiksha Gundecha
Cloud-Native GIS
Geospatial Data Management
Geospatial Data Formats
GIS Technology
Cloud Optimized GeoTIFF
GeoParquet
PMTiles
LiDAR Data

Cloud-native formats let software pick up just the piece it needs.
Open a large dataset to look at one village, and watch what happens. Sometimes the software happily grabs only what it needs. Other times it quietly pulls the whole file first. The difference is not your internet speed. It is how the file was laid out when it was saved.
In the https://rottengrapes.tech/blogs/cloud-native-gis-how-gis-systems-are-built/ we saw that cloud-native GIS means letting software read just the part of the data it needs. This post is about the files that make that possible.
Why the old favourites struggle at scale
Shapefile, GeoJSON and plain GeoTIFF are not bad formats. They are wonderful for handing data to a colleague. They were simply designed when data lived on a local disk, and reading a whole file was cheap. Over the internet, with very large data, their design shows:
• Shapefile is really a bundle of files (.shp, .shx, .dbf, .prj) that must travel together. Each part is limited to 2 GB, and field names are cut to 10 characters. It was never meant to be read in slices over the web.
• GeoJSON is readable text, which is great for a small web map. But the reader usually must download and parse the whole file before it can use any of it, and there is no built-in way to jump to one area.
• A plain GeoTIFF often stores pixels in long strips and may have no lower-resolution copies. Asking for a small window means reading far more than you need and zooming out means reading nearly everything.
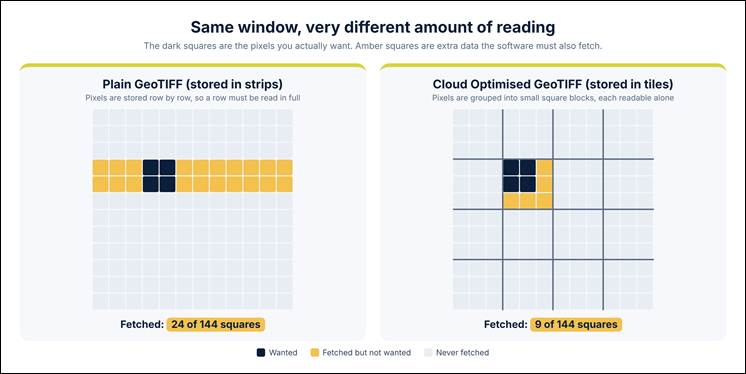
The same small window, read from a strip-based file and from a tiled file. A real example: in a 10,000 × 10,000-pixel image, a 500 × 500 window needs about 250 KB but can pull around 5 MB from strips (illustrative, uncompressed, one-row strips).
The recipe cloud-optimised formats share
Every format below follows the same idea. Think of a book with a good table of contents: you check the contents, then open only the pages you want.
1. Put the index at the start. One small read tells the software where everything is.
2. Cut the data into chunks that can each be read on their own.
3. Fetch only the chunks needed, using an HTTP range request, which simply means asking storage for a specific slice of bytes.
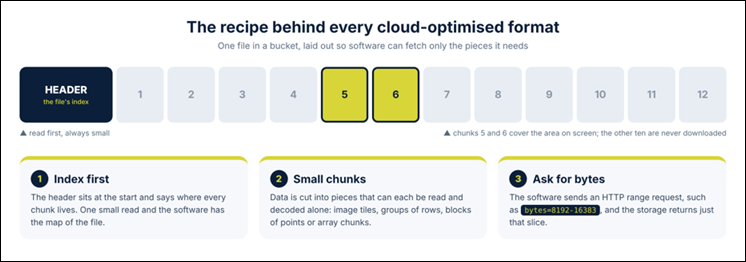
The index is read first, and only the chunks that cover your area are downloaded.
The best format depends on what kind of data you have. Here are the five you will meet most often.
COG: the raster, rearranged
A Cloud Optimized GeoTIFF is still a GeoTIFF, so it opens everywhere a GeoTIFF does. The difference is the layout: it is split into internal tiles and carries overviews (smaller, zoomed-out copies), with its index up front. A viewer showing a whole district reads a small overview. Zoom to a village and it reads only the tiles there.
Suits: satellite imagery, elevation models, land cover. Pick it whenever you share or serve a raster online. Watch out: not every GeoTIFF is a COG, and zipping one removes the benefit.
GeoParquet: vector data as a smart table
GeoParquet stores points, lines and polygons in Apache Parquet, a format that keeps each column together instead of each feature. A reader asking about building heights can read just that column and skip the rest, and it can skip whole blocks of rows that cannot match. Files are also compressed well.
Suits: large vector tables such as building footprints, parcels or GPS points, analysed with GeoPandas, DuckDB or GDAL. Watch out: it is built for reading and analysis, not for live editing, and files are rewritten rather than updated. The specification is still maturing, and standardisation through the OGC is under way.
PMTiles: a whole map in one file
PMTiles packs a pyramid of map tiles into a single file. A web map such as MapLibre reads only the tiles on screen, straight from storage, with no tile server running.
Suits: basemaps and display-only layers, as vector or raster tiles. Watch out: it is for showing data, not analysing it, and updating means rebuilding the file. Your storage must support range requests.
COPC: LiDAR you can stream
Cloud Optimized Point Cloud is a LAZ file whose points are arranged into an octree, cubes inside cubes. A viewer loads a coarse sample first and fetches finer detail only where you look.
Suits: LiDAR and other large point clouds. Watch out: newer than plain LAZ, so tool support is still catching up, though it remains a valid LAZ file.
Zarr: data cubes cut into chunks
Zarr stores multi-dimensional arrays, such as temperature by latitude, longitude, height and time, as many small, compressed chunks. Software loads only the slice you ask for.
Suits: climate, weather, ocean and long satellite time series, usually analysed in Python with Xarray. Watch out: it is aimed at scientific analysis, and geospatial conventions for Zarr (GeoZarr) are still a draft.
Which format for which data?
Your data | Pick | Good for | Watch out |
Raster images, elevation | COG | Sharing and serving rasters online | Make sure it is truly tiled; don't zip it |
Vector features for analysis | GeoParquet | Big tables, fast filtering | Not for live editing; spec maturing |
Map display layers | PMTiles | Serverless web maps | Display only; rebuild to update |
LiDAR points | COPC | Streaming point clouds | Fewer tools than plain LAZ |
Multi-dimensional data over time | Zarr | Climate and data-cube analysis | GeoZarr still a draft |
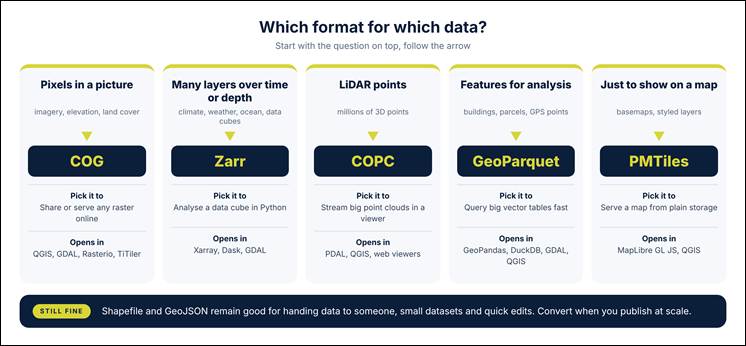
Start with the kind of data you hold, then follow the arrow to the format.
One more format deserves a mention: FlatGeobuf, a single-file vector format with a streamable spatial index, handy for serving features to web apps.
What this does not mean
• You don't have to throw away Shapefile or GeoJSON. They remain fine for exchange and small data. Edit in QGIS as always, then publish in a cloud-native format.
• One format will not do everything. Each one is built for a kind of data and a kind of access.
• You need not convert everything today. Start with your largest, most-used dataset.
Conclusion
The pattern is simple: formats built for the cloud keep an index up front and store data in small pieces, so software reads only what it needs. Match the format to your data, and your maps, models and dashboards get faster without a bigger server.
"Now that we understand the formats that make cloud-native geospatial access possible, the next step is understanding where these datasets are stored and how they are accessed, discovered and processed."